CLOSE TO HOME
An energy intimacy manifesto

1
The Past is a Foreign Climate
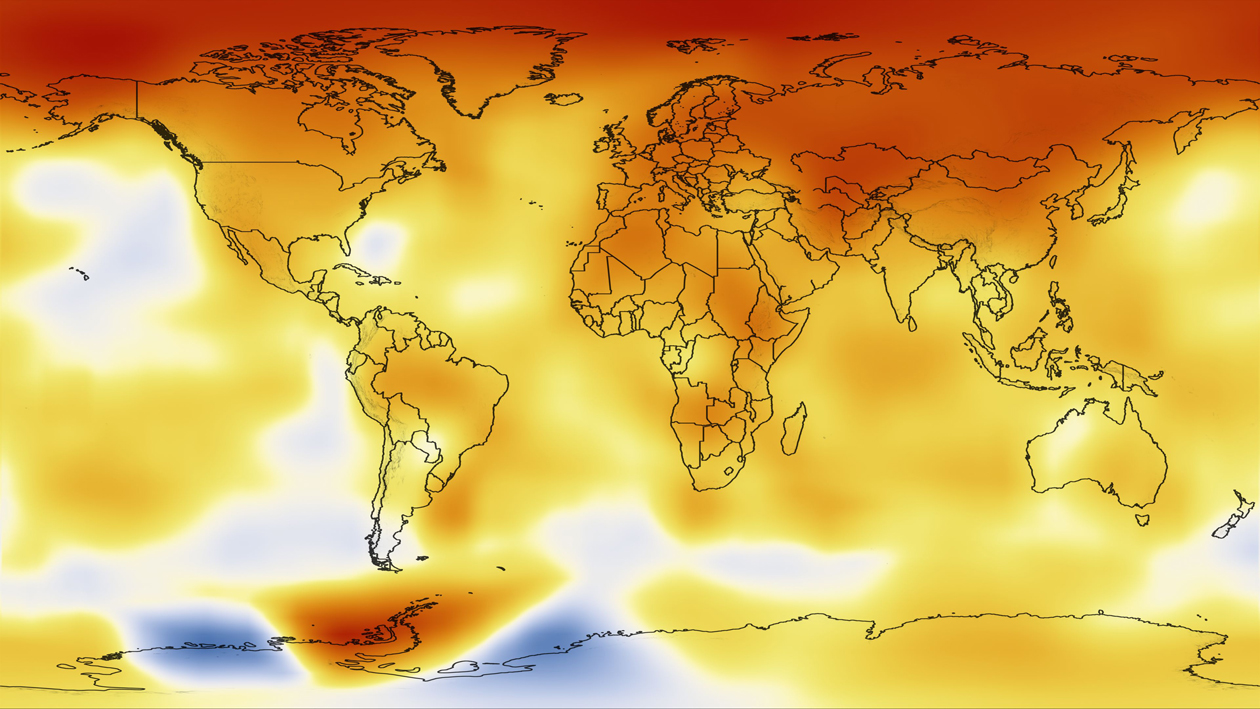
We live in times of accelerating climate change which in turn produces changes in weather, which in turn causes major problems across the world.
We must acknowledge that the droughts, the flash floods, and other extreme events are not singular events, but part of a new normal.
As a result of our actions, we must change how we operate, to find ways of prospering while itigating and preventing the worst scenarios from occurring.
2
No Energy is Anonymous
Part of the problem is that energy is anonymous – we choose to deliberately hide our energy infrastructure
Many of the infrastructures most intimately linked to our current predicament are all around us and yet hidden from sight. Like pipes and power-cords hidden away from sight in a modern housing development, most people never get to set sight on and understand the ways in which energy moves throughout society.
This practice erroneously makes energy feel anonymous and of infinite supply.
3
Provenance New Vibrance
The energy used in our homes comes from real places, even if it does not come with provenance labels documenting its origin. In these places the wind blows, the sun shines, or perhaps some gas plant fires its turbines. There are people and communities who call these places home.
In a world powered by renewables, energy becomes local and variable based on weather patterns. The weather is not just outside, but by lending power to the renewables running your devices and infrastructure it is inside as well.
This should change the shape of not just our built environment, but also how we relate to energy culturally.
experiments
¶Energyproverb.net
Last edited: 2021-12-08
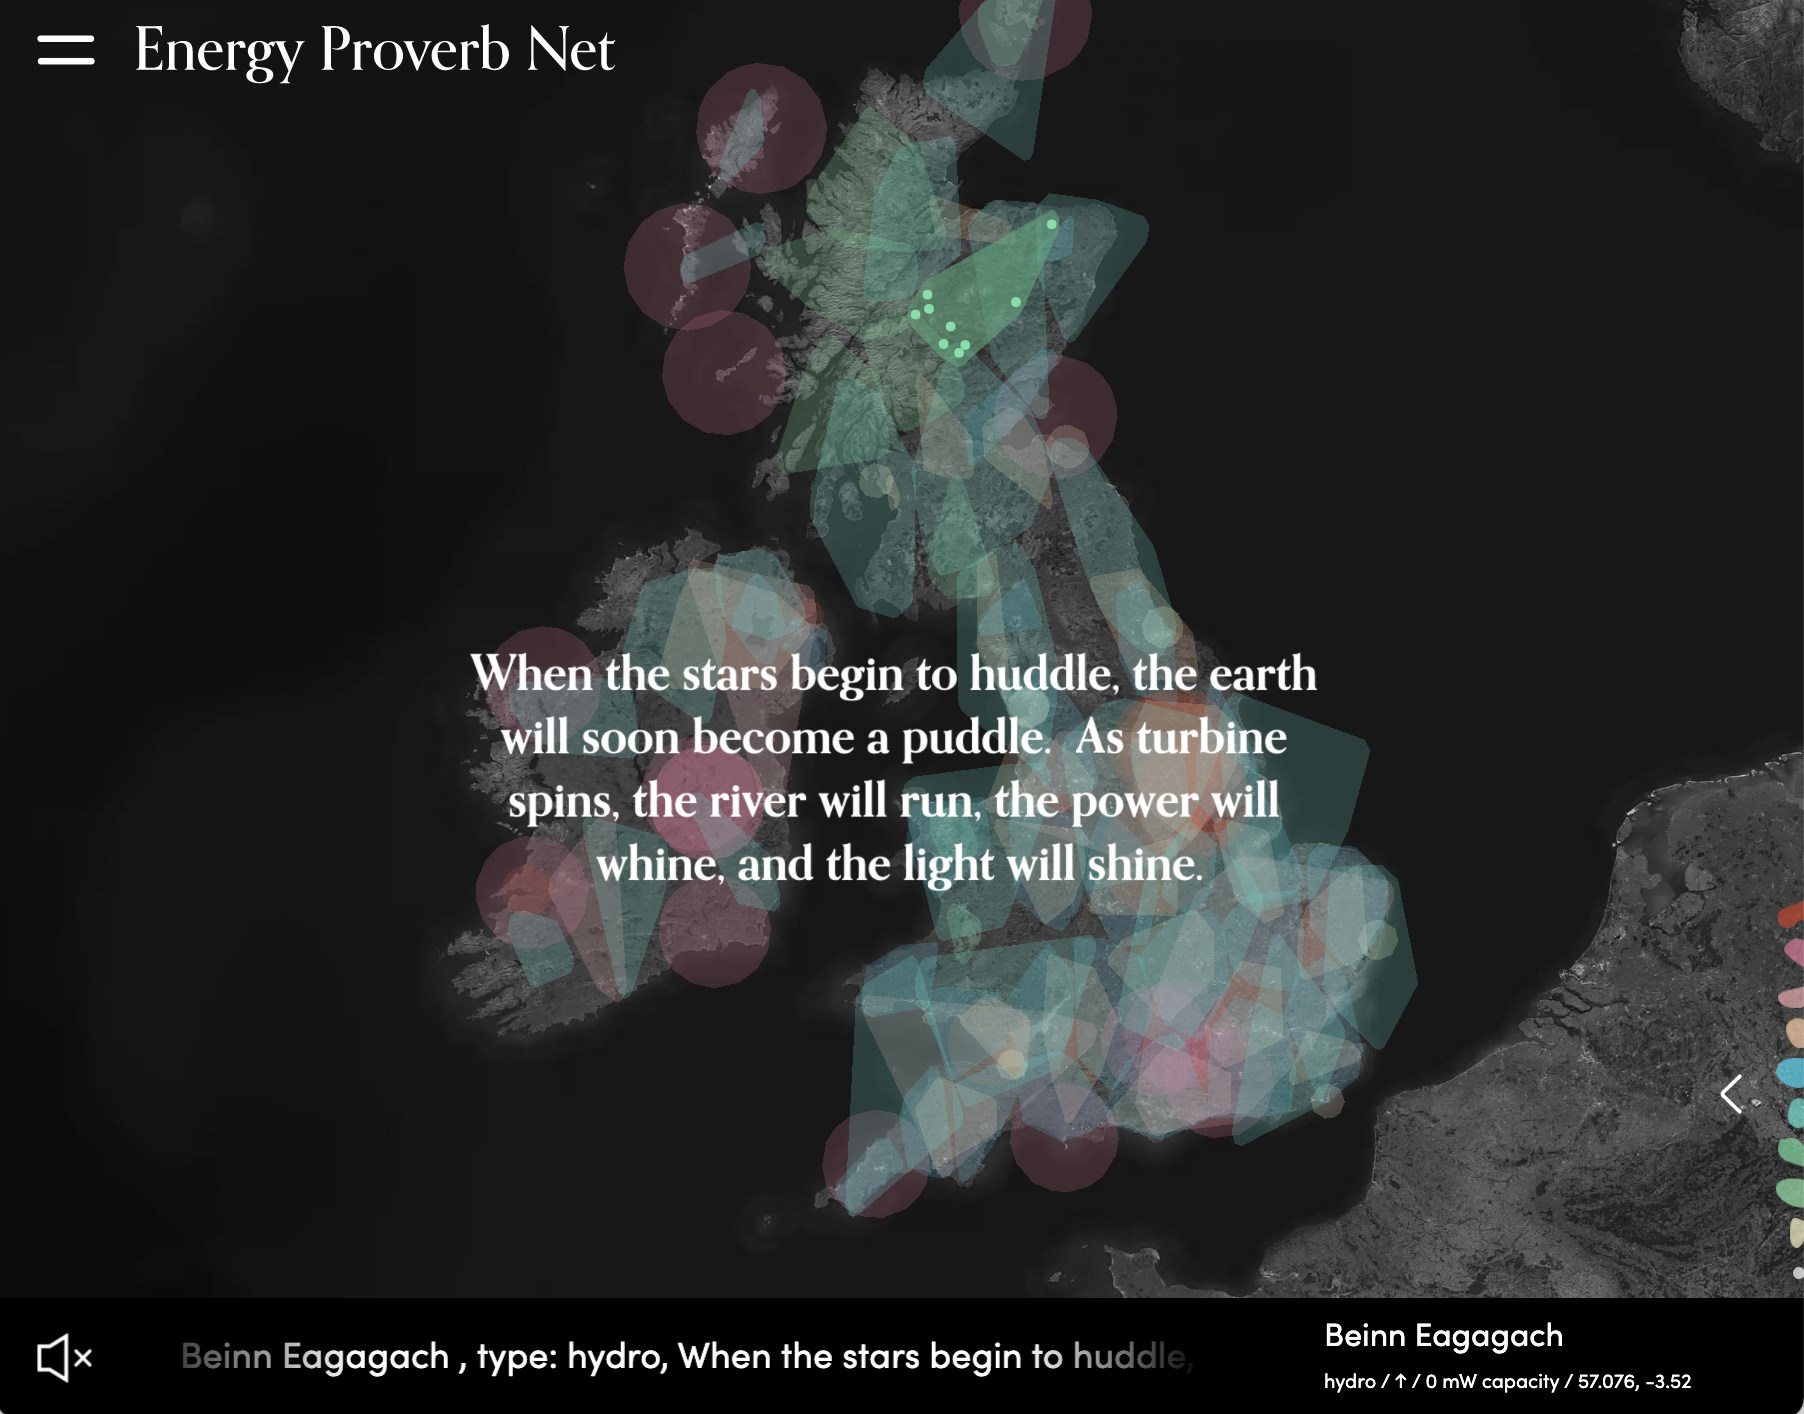
Energy Proverb Net considers the potential of mapping and proverbs to transform the way energy is understood.
This project aims to make senseable the material quality of otherwise-intangible, complex and somewhat magical nature of energy systems. Energy Proverb Net explores the historical and future use of proverbs in renewable energy projects. The project does this through the exploration of friction which exist between technology and wildernes, the synthetic and the authentic, the spoken-word and machine learning.
In a world powered by renewable technologies such as solar and wind, energy systems become highly dependent on weather patterns.
Sunny spells, windy days, and calm skies can all affect the amount of renewable energy that we are able to produce. And whilst there may always be backup systems in place, these tend to draw energy from carbon-intense sources. The weather is not just outside, but by lending power to the renewables running your devices and infrastructure it is inside as well. This should change the shape of not just our built environment, but also how we relate to energy culturally.
The system in which it is generated and distributed is too large and too complex to understand easily. We take for granted the resources that goes into the process of collecting, refining, processing, and delivering power to us, and are often blind to its impact on global carbon emissions.
When it arrives, in the form of power that keeps our devices, lights, and utilities on – it is all the same. This lack of visibility and knowledge prevents us from truly understanding our consumption. This practice erroneously makes energy feel anonymous and of infinite supply.
We believe it is necessary for us to adapt many aspects of our behaviour to embrace the natural cycles that these sources bring. From the our sense of time to the language we use, from our celebrations to the ways in which we share with others. Our futures depend upon it.
¶Material intimacy
Last edited: 2021-12-08

Cultivating a home aesthetic embracing a newfound closeness with energy technology
We imagine a home environment where energy objects are treated with as high affection as, for example, we have towards house plants. This is a future where biophilia evolves into photovolphilia.
In this future, energy goes from being an anonymous necessity, to being a known aesthetic. This is explored through a series of energy objects for the home that heavily reference trends in modern houseplant culture.
¶Energy rhytmns
Last edited: 2021-12-08
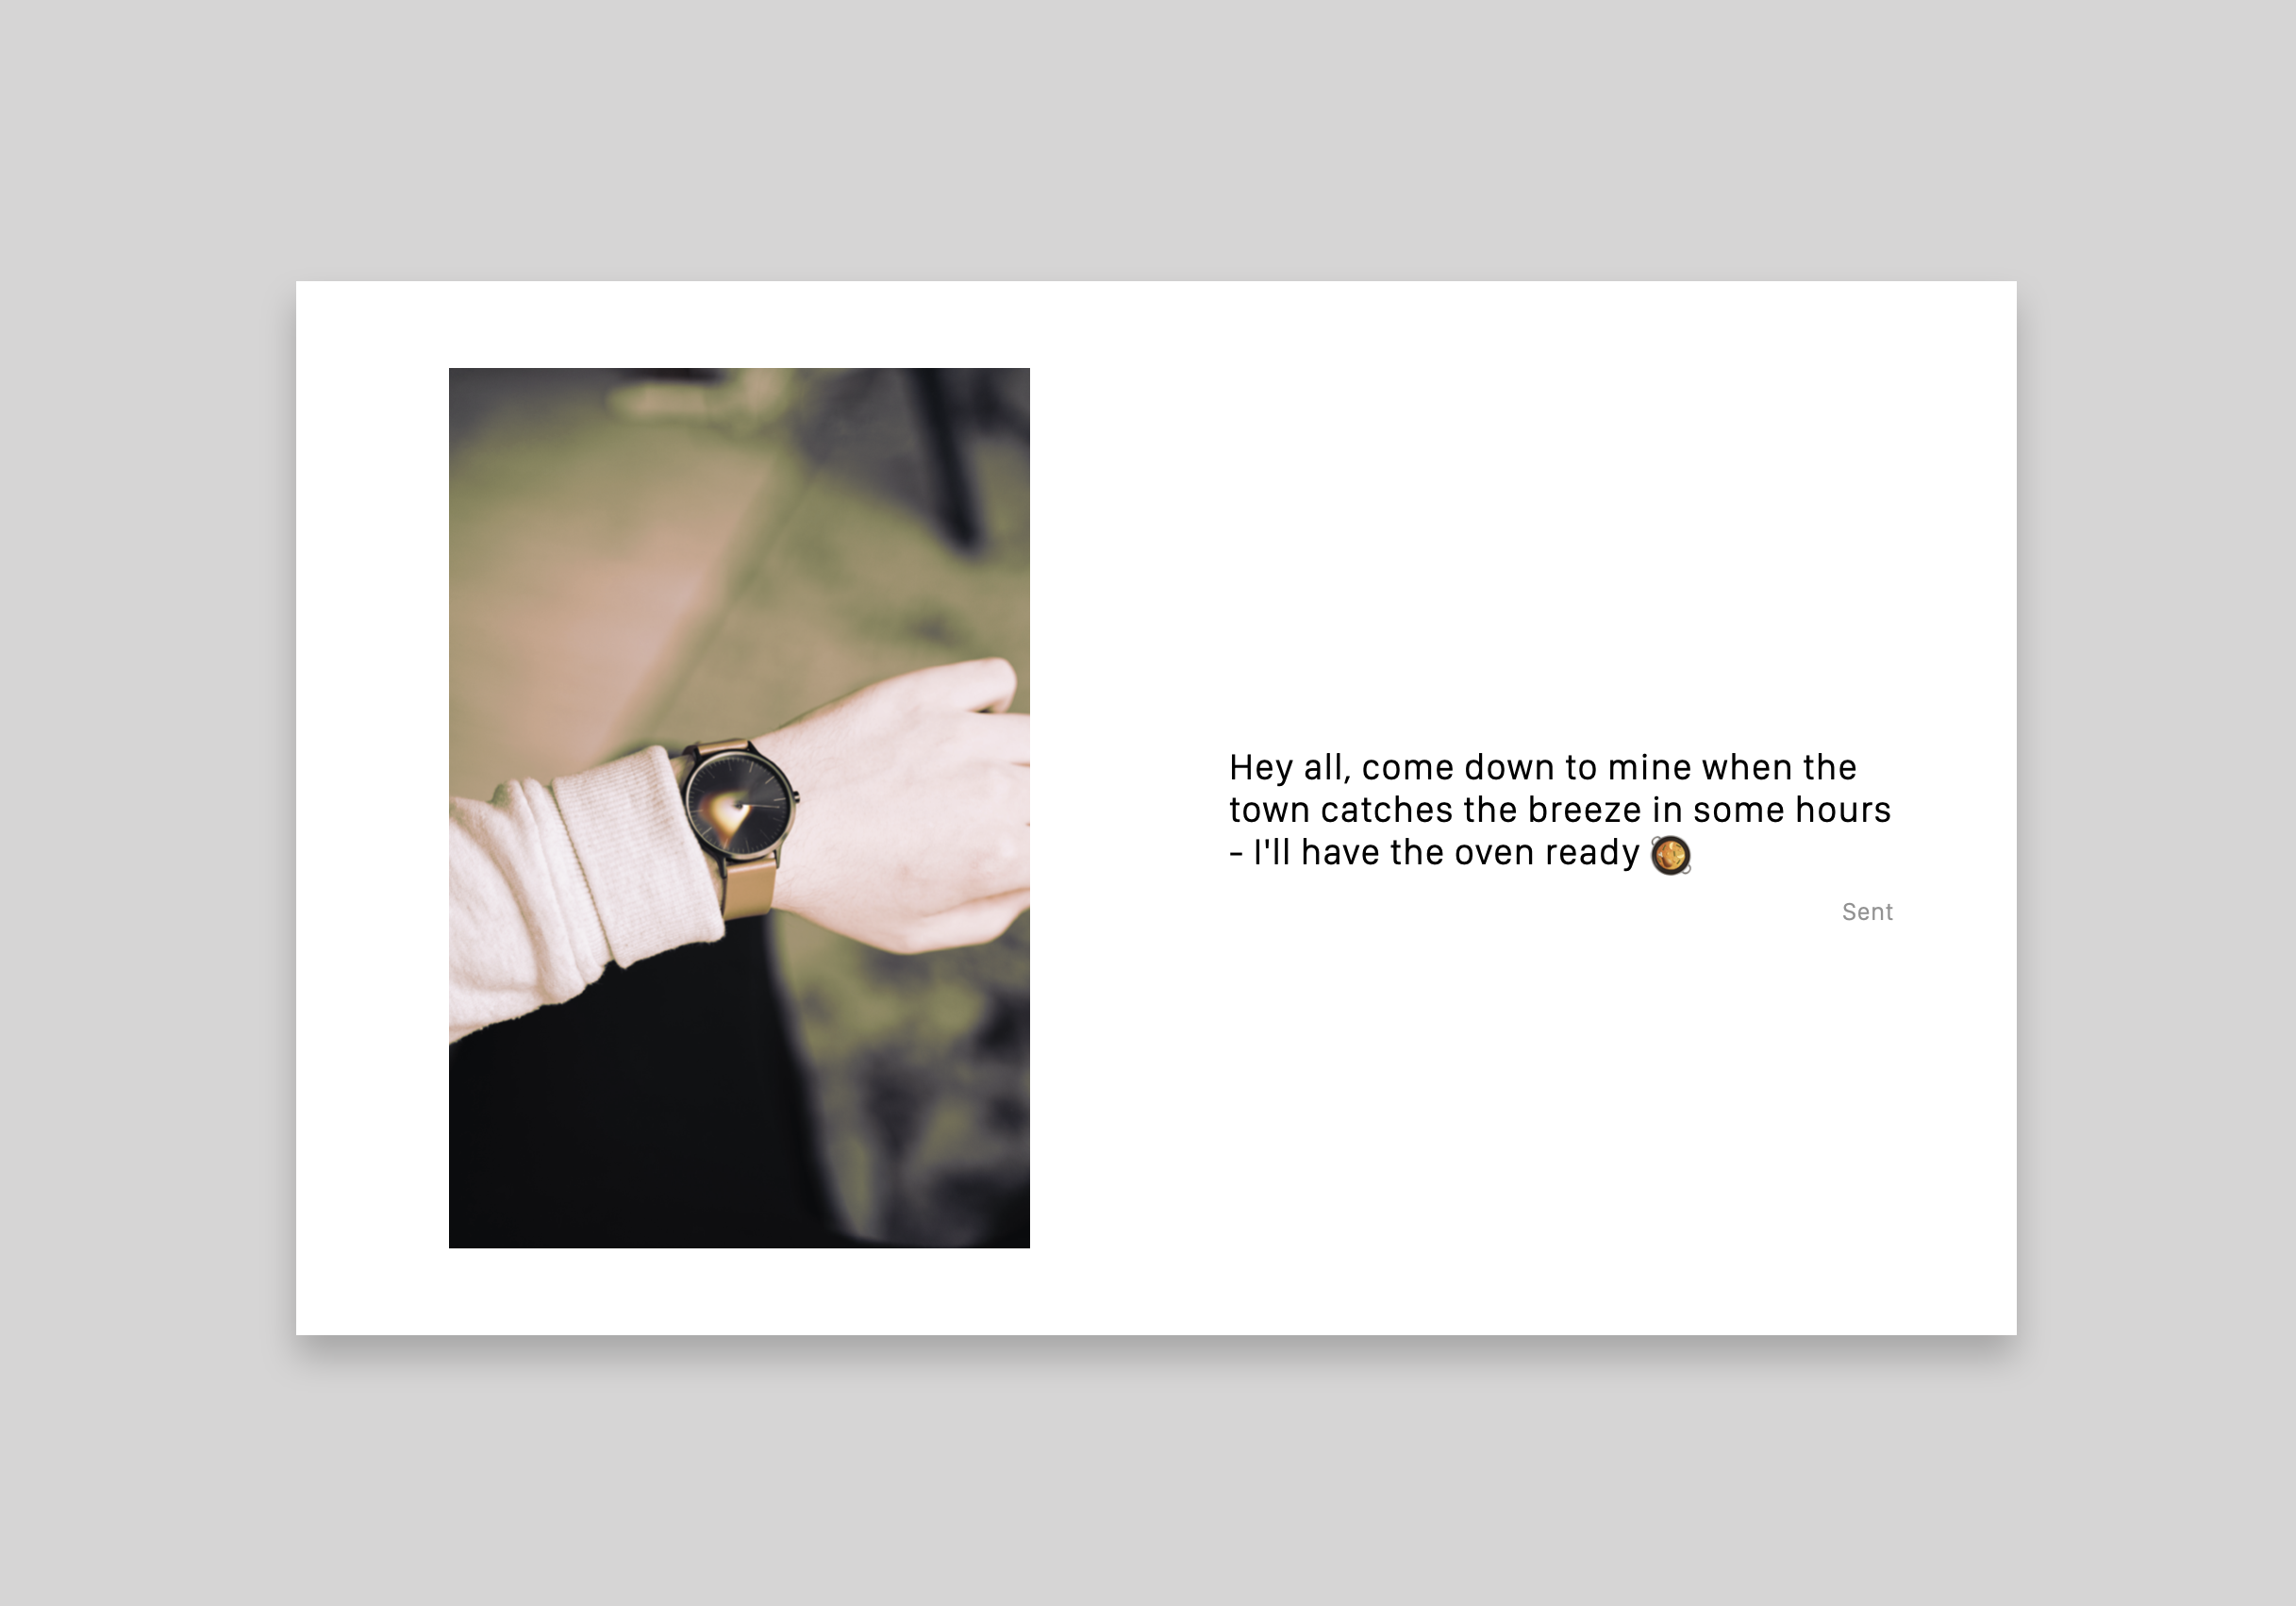
We'll need better understand the finite nature of energy and its constant fluctuations. We imagine a watch that shows, instead of hours and minutes, how much energy is to be harvested locally, allowing people to plan their days around it.
investigations
¶Who gets to dictate which landscapes to show and which ones to hide?
Last edited: 2021-12-08
.png)
Jona: all of the coal mines are cropped out of the data…
Michael: That's bizarre.
Michael: I was going to suggest maybe it was cropped out to prevent people from finding access points, but lidar data isn't typically censored from what I've seen before
Jona: yeah, maybe they aren’t cropped, true — actually seems like some of the data does cover it
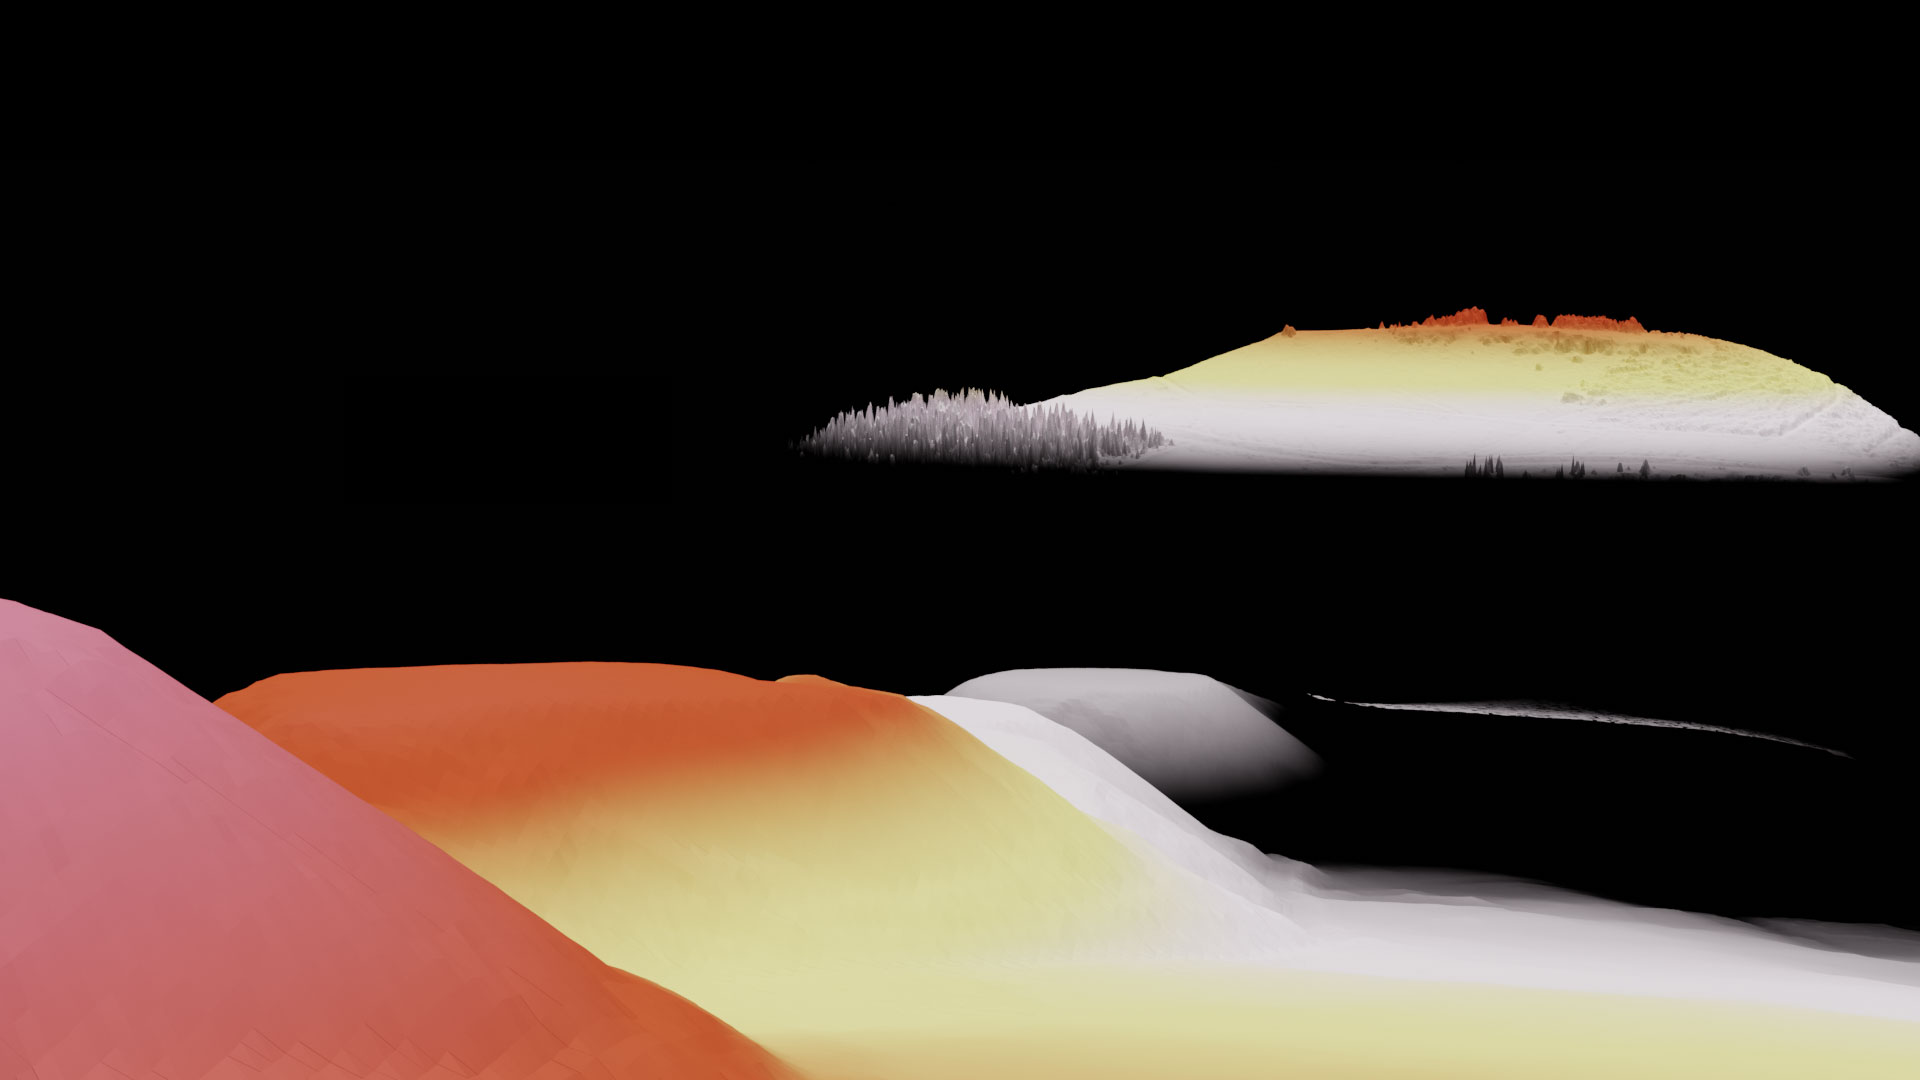
Energy exists on the scale of satellite imagery. It's infrastructure is visible from above when we as individuals are not. It shapes landscapes.
We believe in problematising our energy landscapes by cartographically countermapping their existence is a powerful way to ask questions about the role energy infrastructure plays in shaping the modern experience.
¶Proverbs used to be collected as intel by armies
Last edited: 2021-12-09
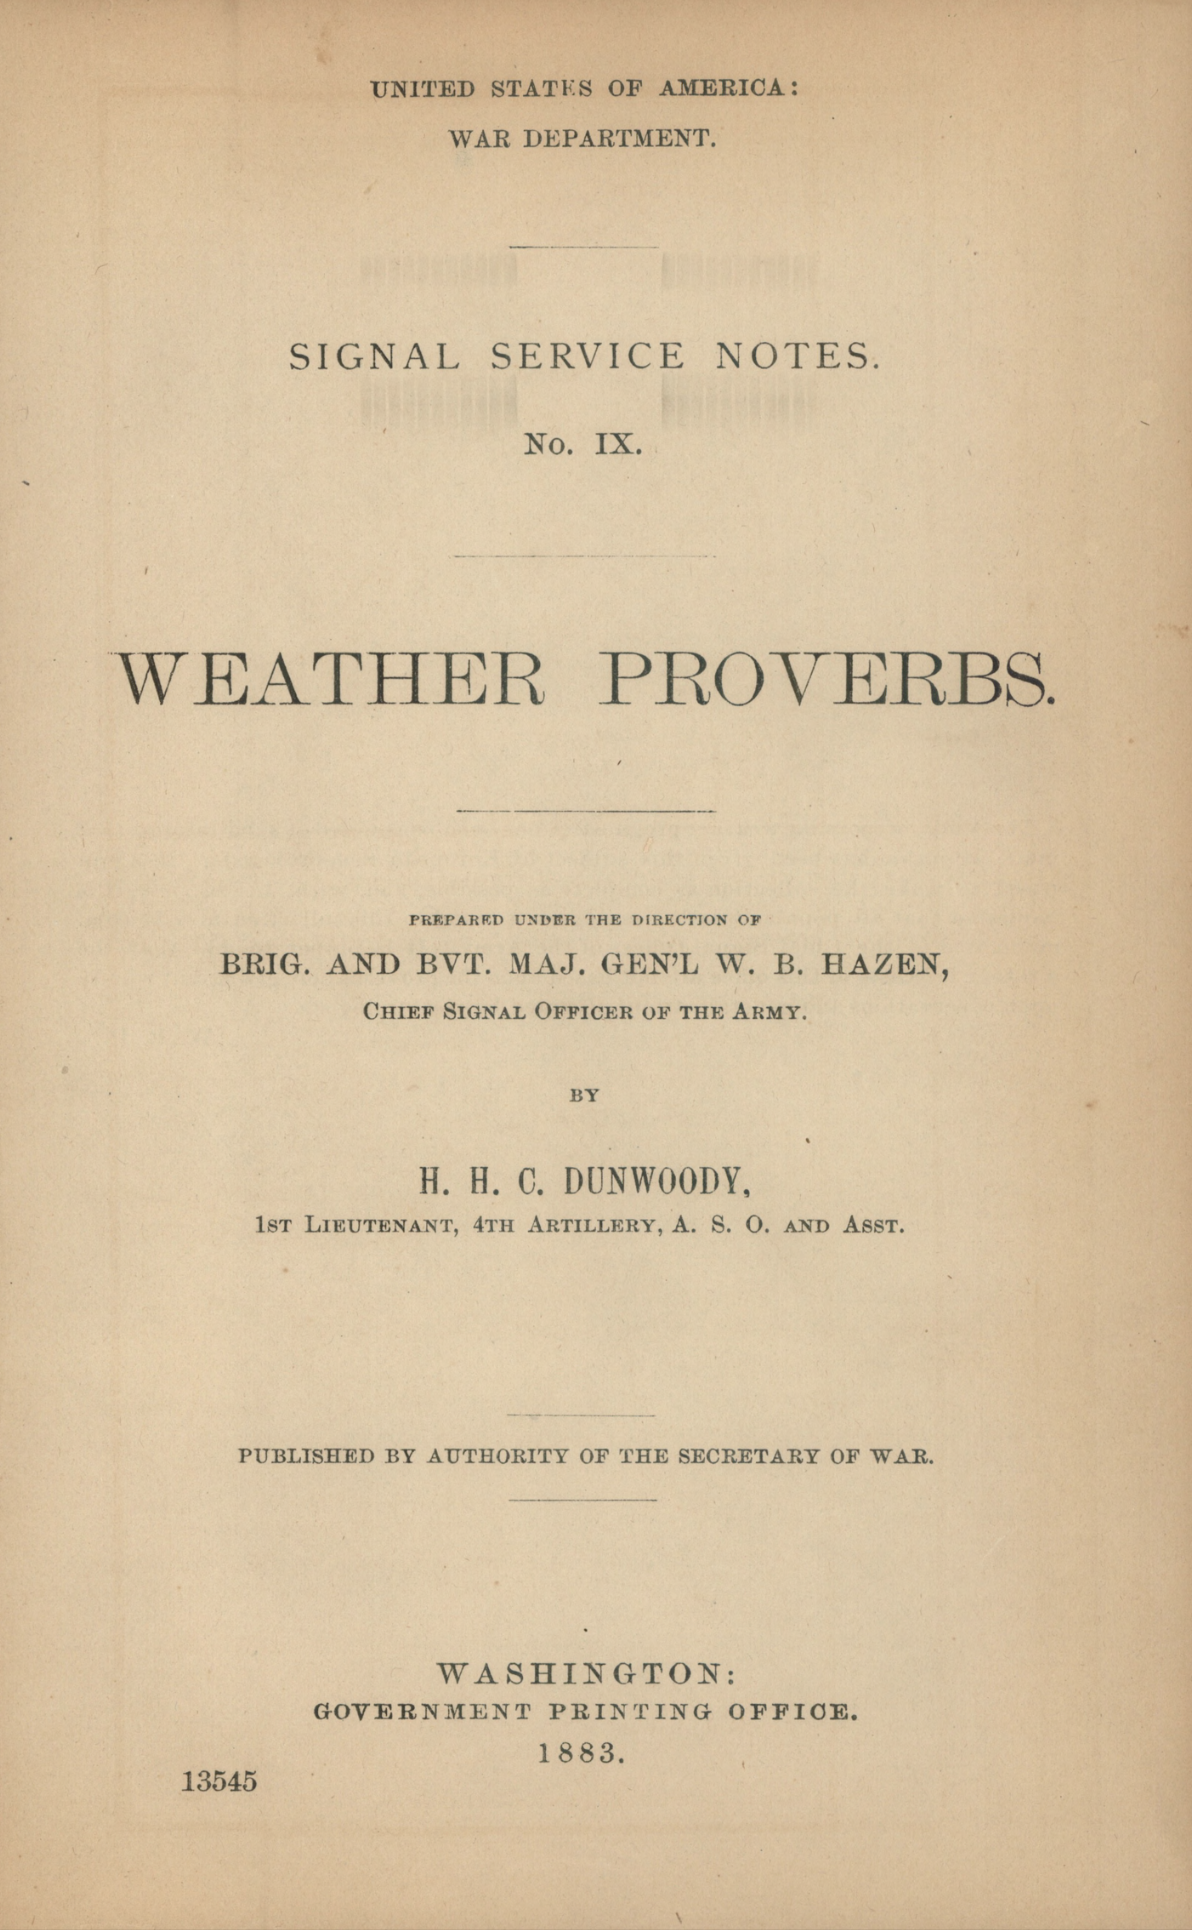
Weather Proverbs, written in 1883 by the US Government
148 pages of proverbs used by the US government to advise on weather prediction, or "weather prognostics" as they refer to it.
¶Mapping every power plant
Last edited: 2021-12-08
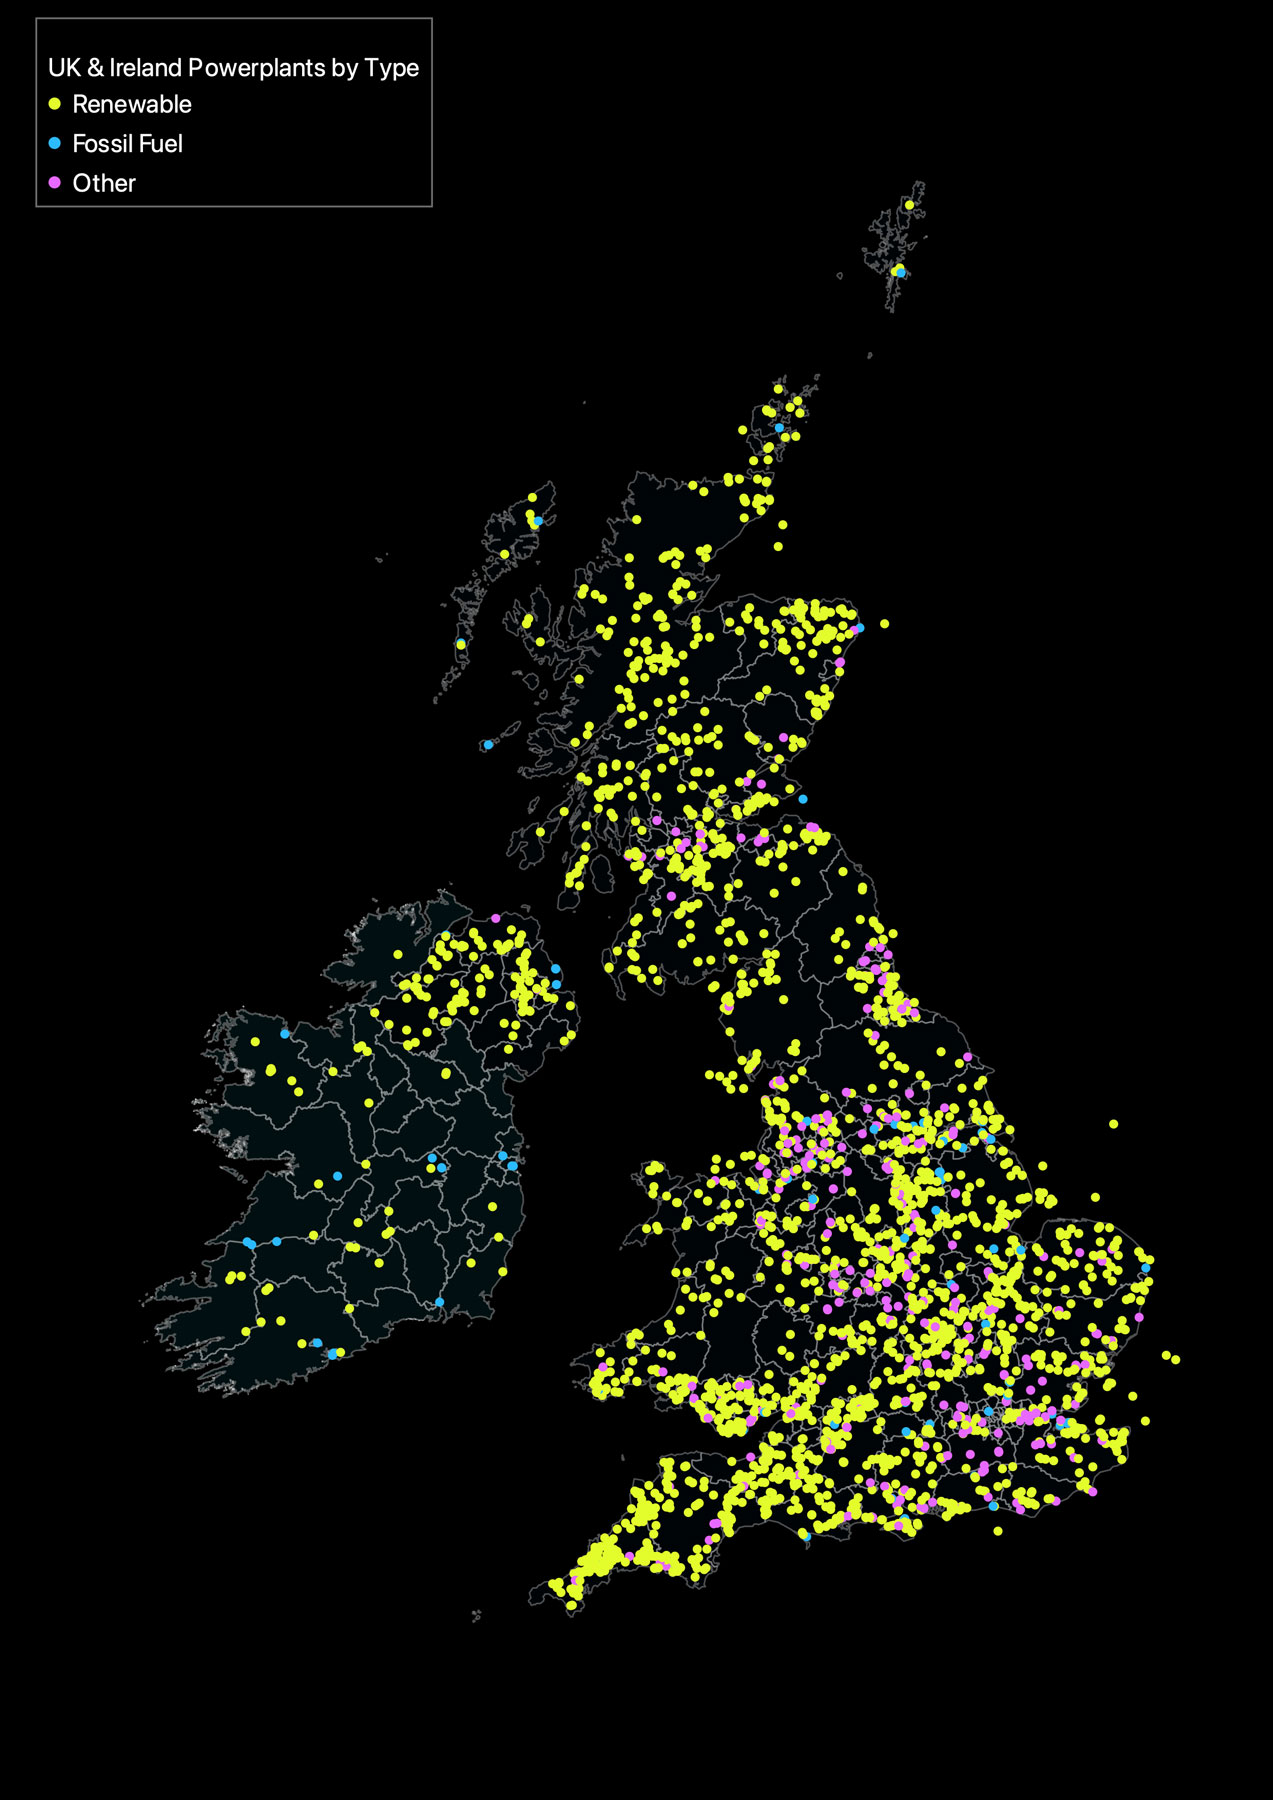
We began by quickly mapping every power plant in the United Kingdom and Ireland.
Data for this is readily available. In our case, we used a combination of datasets from Elexon and the World Resources Institute. With a bit of cleaning in R and a quick export via ggplot2, we're able to quickly see just how many power sources feed into the grid of the British Isles.
But – this picture is misleading. By not scaling for capacity, we're overly skewing the data towards renewables, and getting a wildly different picture than is the reality.
¶Adding scaling to reveal the reality
Last edited: 2021-12-08
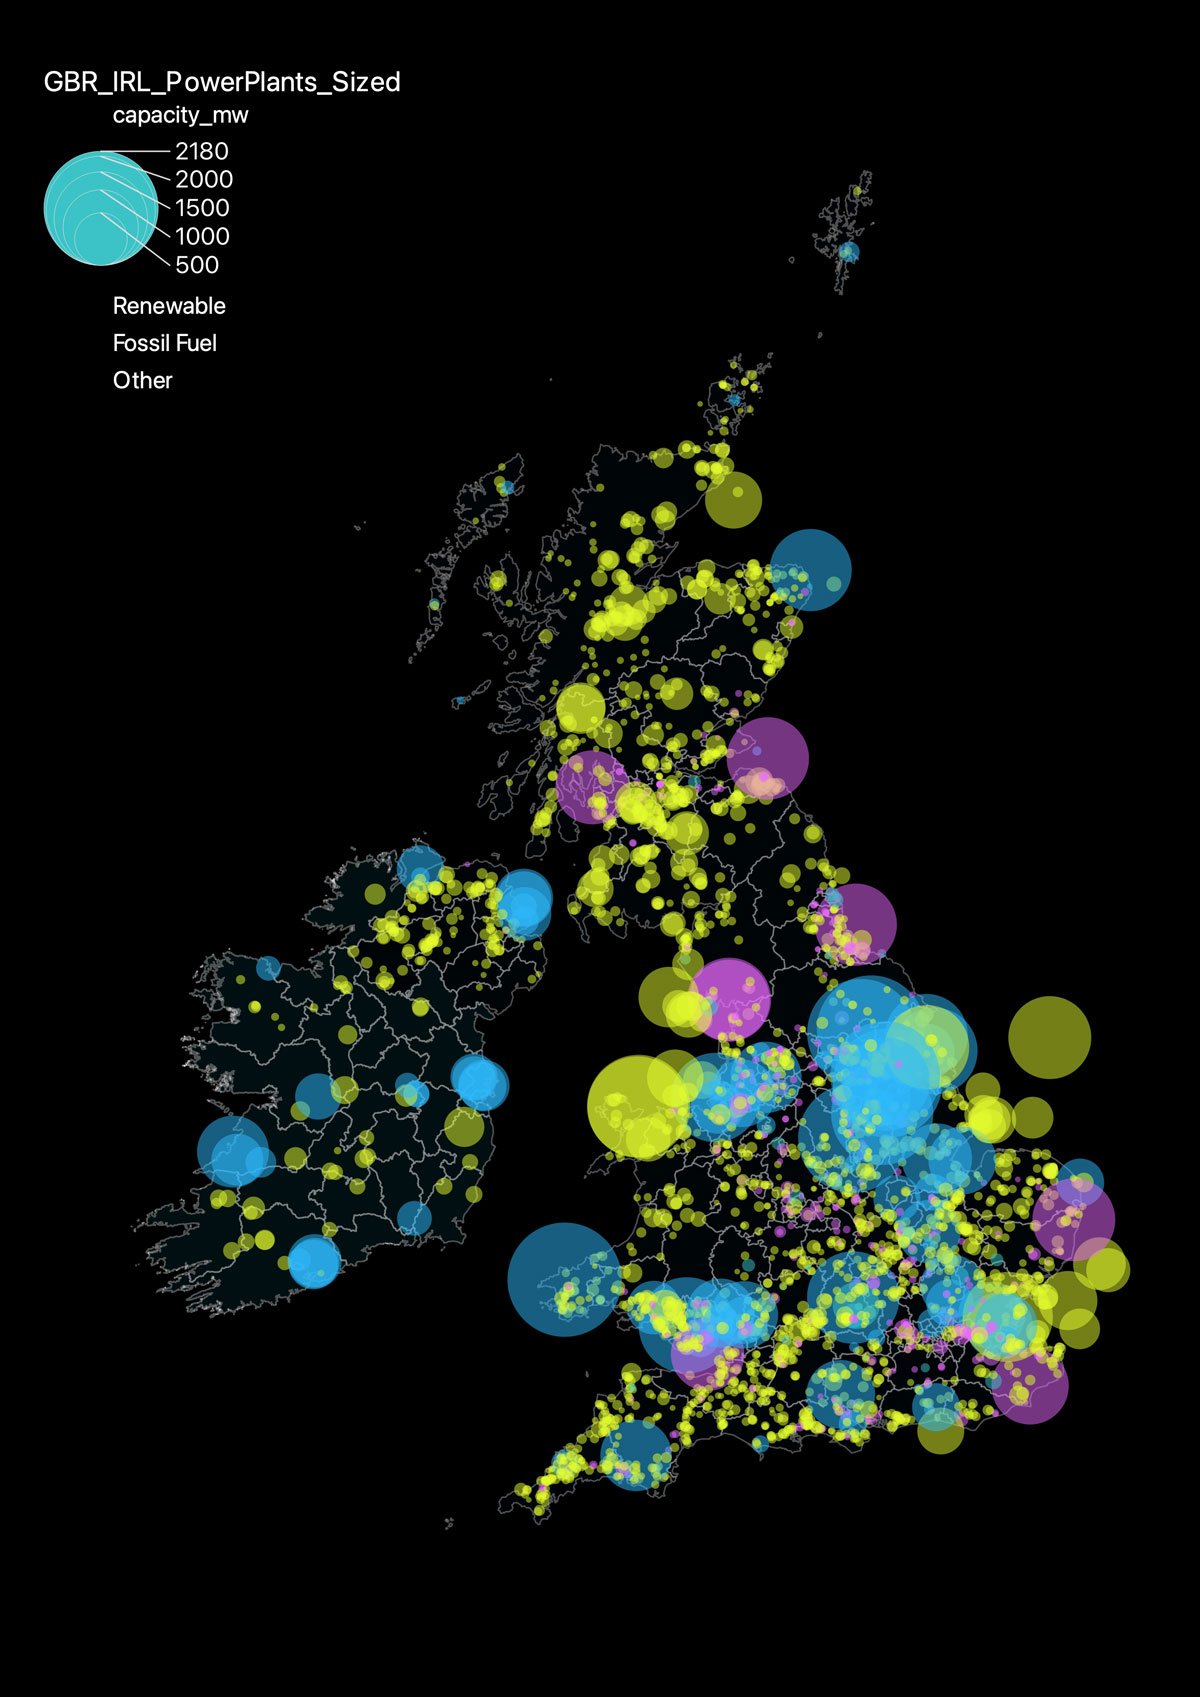
As our dataset contains capacity (defined as megawatts), we're able to now see the reality of the situation.
In this view, we can see that whilst there are many small renewable power stations, capacity tends to be considerably smaller than that of fossil fuels. This got us thinking of carbon regions – or – how certain regions are richer in access to more renewables. We began to wonder – what would happen if we imagined the British isles, parcelled off into different energy regions.
¶Creating energy regions
Last edited: 2021-12-08
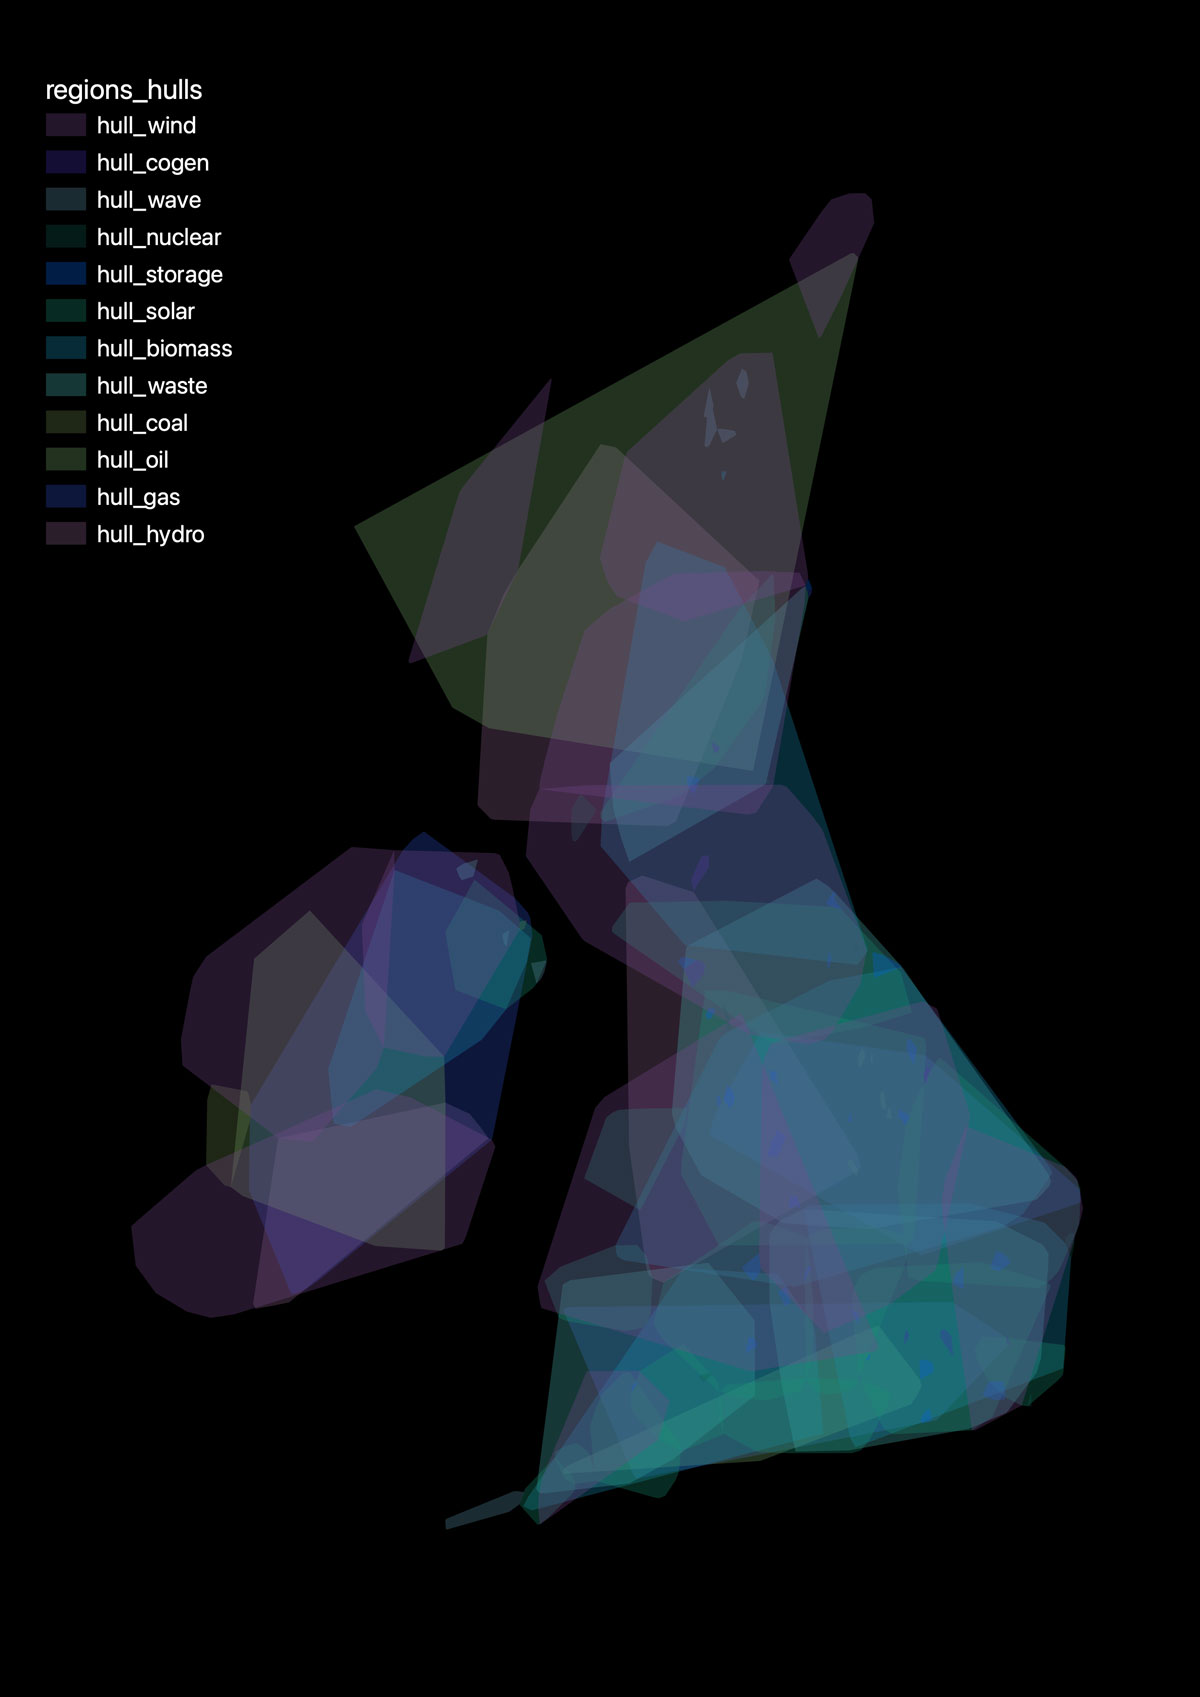
Pulling the data into QGIS, we were then able to create energy regions for the British isles. These regions are created through a clustering algorithm and then shaped and scaled based on a region's total capacity.
At the current moment, these are basic energy clusters - but in the future we'd like to explore how energy regions are weighted by local population density and actual recored energy demand.
¶Resilience & adaptation
Last edited: 2021-12-08
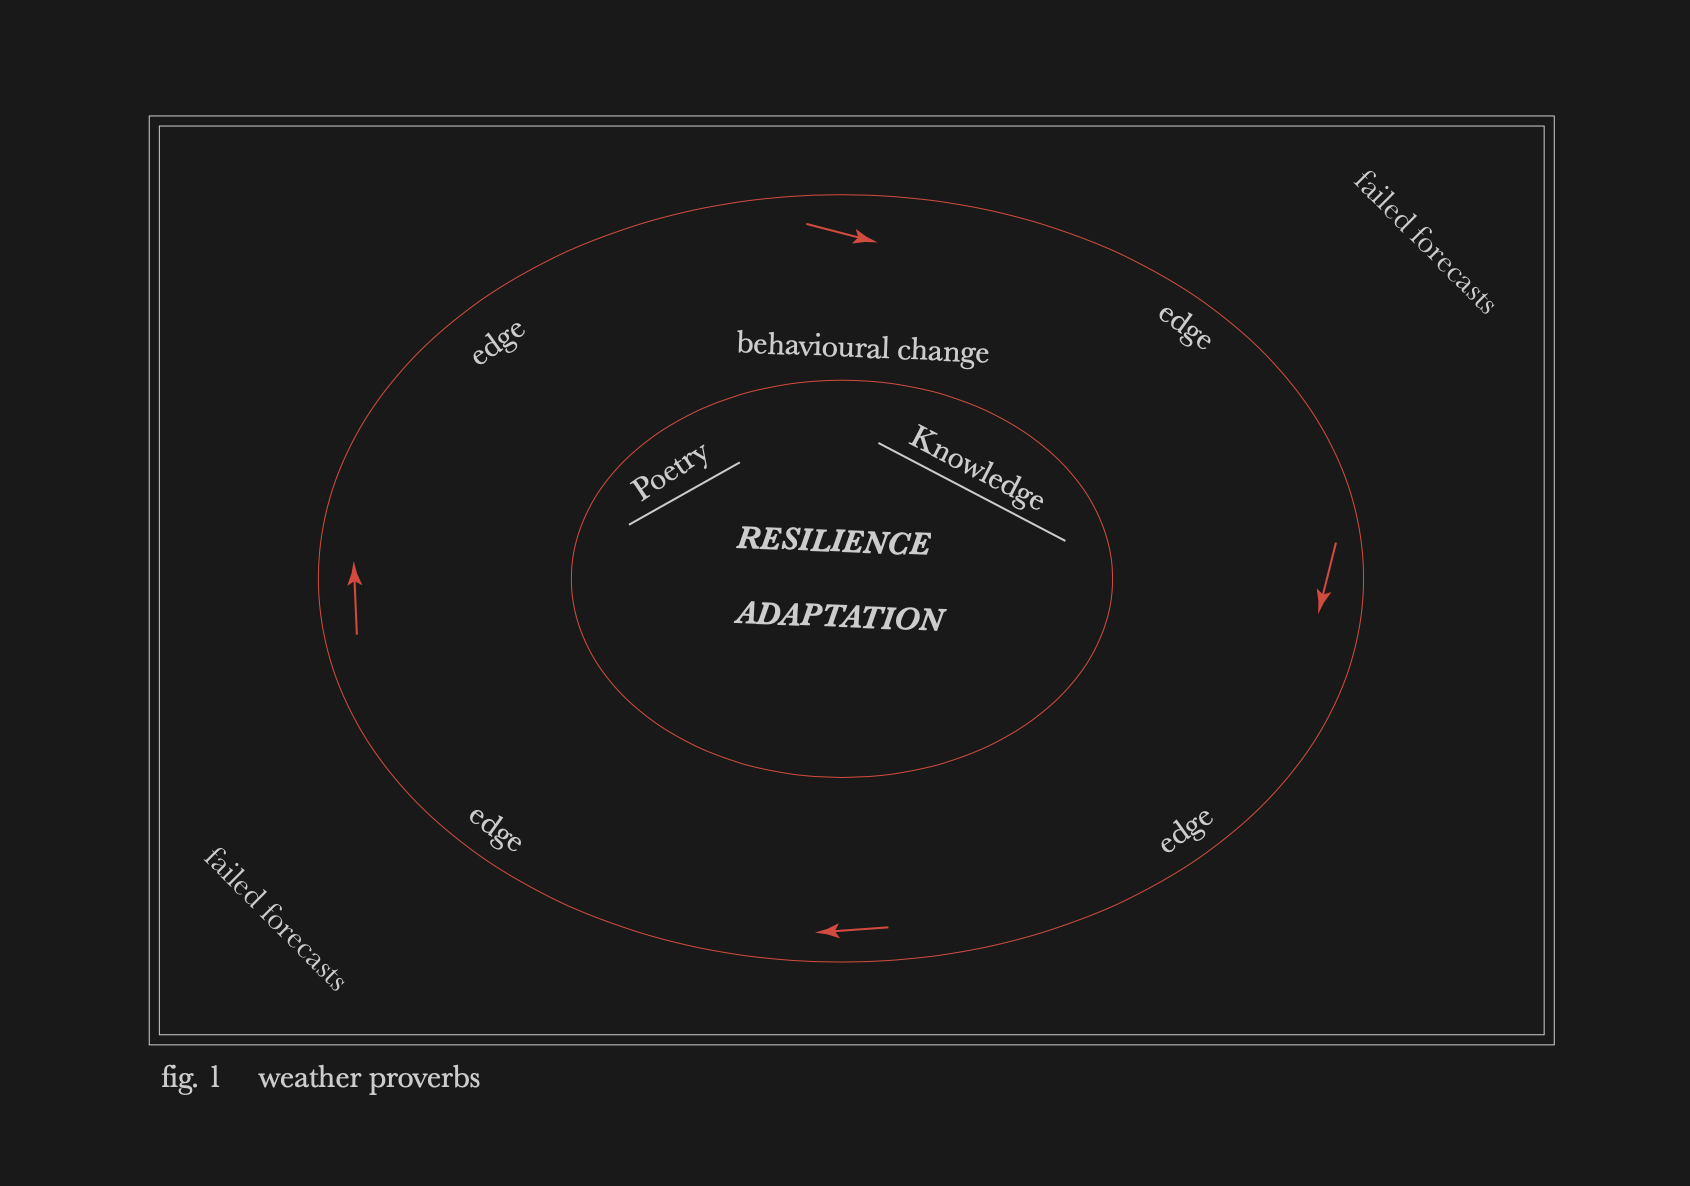
As our climate shifts, we'll need ways of knowing when its acceptable to consume more or less energy. We imagine a culture/world where community members develop new proverbs inspired by old sayings about weather, making it easy to remember energy's ebbs and flows. We're creating a series of AI-generated proverbs as a prototype.
¶Remaking our relationship with energy
Last edited: 2021-12-08
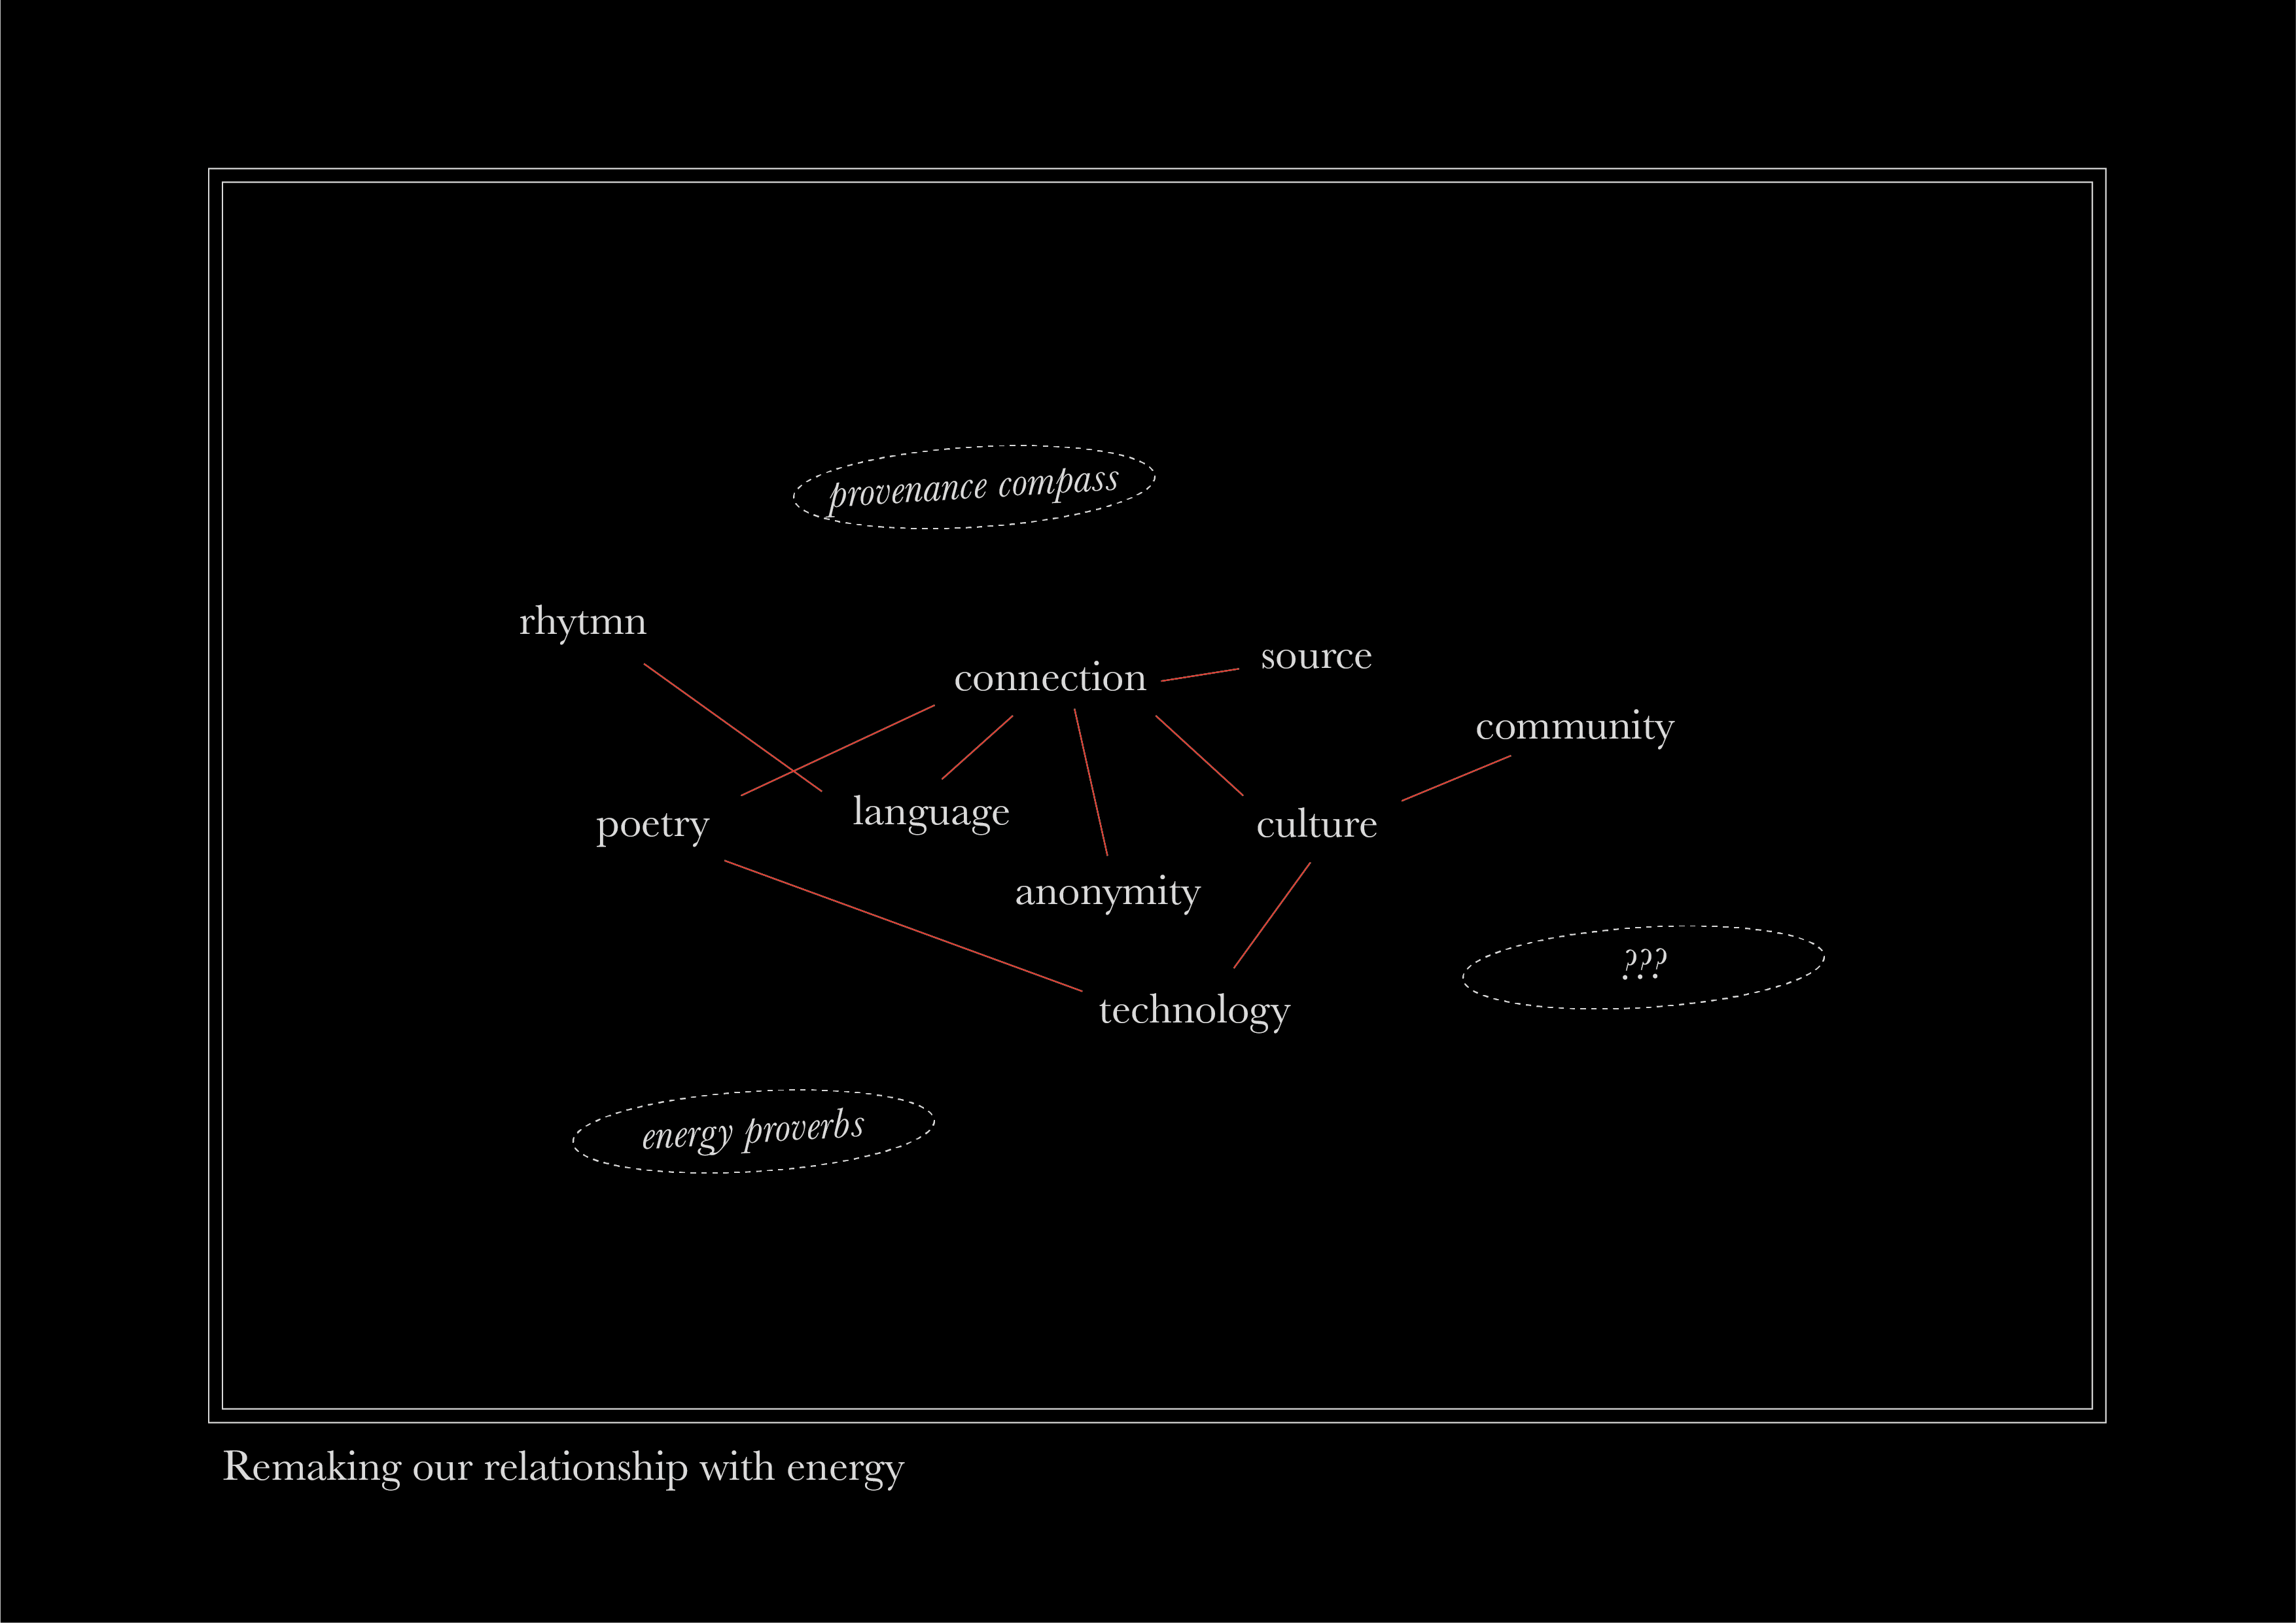
There is too litle romance in the modern world. Open new horizons through poetic intervention.
intro
¶About
Last edited: 2021-12-08
Energy is complex and mysterious.
The system in which it is generated and distributed is too large and too complex to understand easily. We take for granted the resources that goes into the process of collecting, refining, processing, and delivering power to us, and are often blind to its impact on global carbon emissions.
When it arrives, in the form of power that keeps our devices, lights, and utilities on – it is all the same. This lack of visibility and knowledge prevents us from truly understanding our consumption. This practice erroneously makes energy feel anonymous and of infinite supply.
In a world powered by renewables, energy becomes local and variable based on weather patterns.
The weather is not just outside, but by lending power to the renewables running your devices and infrastructure it is inside as well.
This should change the shape of not just our built environment, but also how we relate to energy culturally.
We believe it is necessary for us to adapt many aspects of our behaviour to embrace the natural cycles that these sources bring. From the our sense of time to the language we use, from our celebrations to the ways in which we share with others. Our futures depend upon it.
To fight climate change, we must radically alter our relationship with energy.
This project aims to make senseable the material quality of otherwise-intangible, complex and somewhat magical nature of energy systems.
Energy Proverb Net explores the historical and future use of proverbs in renewable energy projects.
Intimate Infrastructures explores how domestic objects can alter our relationship with energy systems.
Rhythm of Energy's Hymn explores how our organisation of time can be altered to relate to energy.
¶A future where we forget energy versus a future where we understand energy
Last edited: 2021-12-08
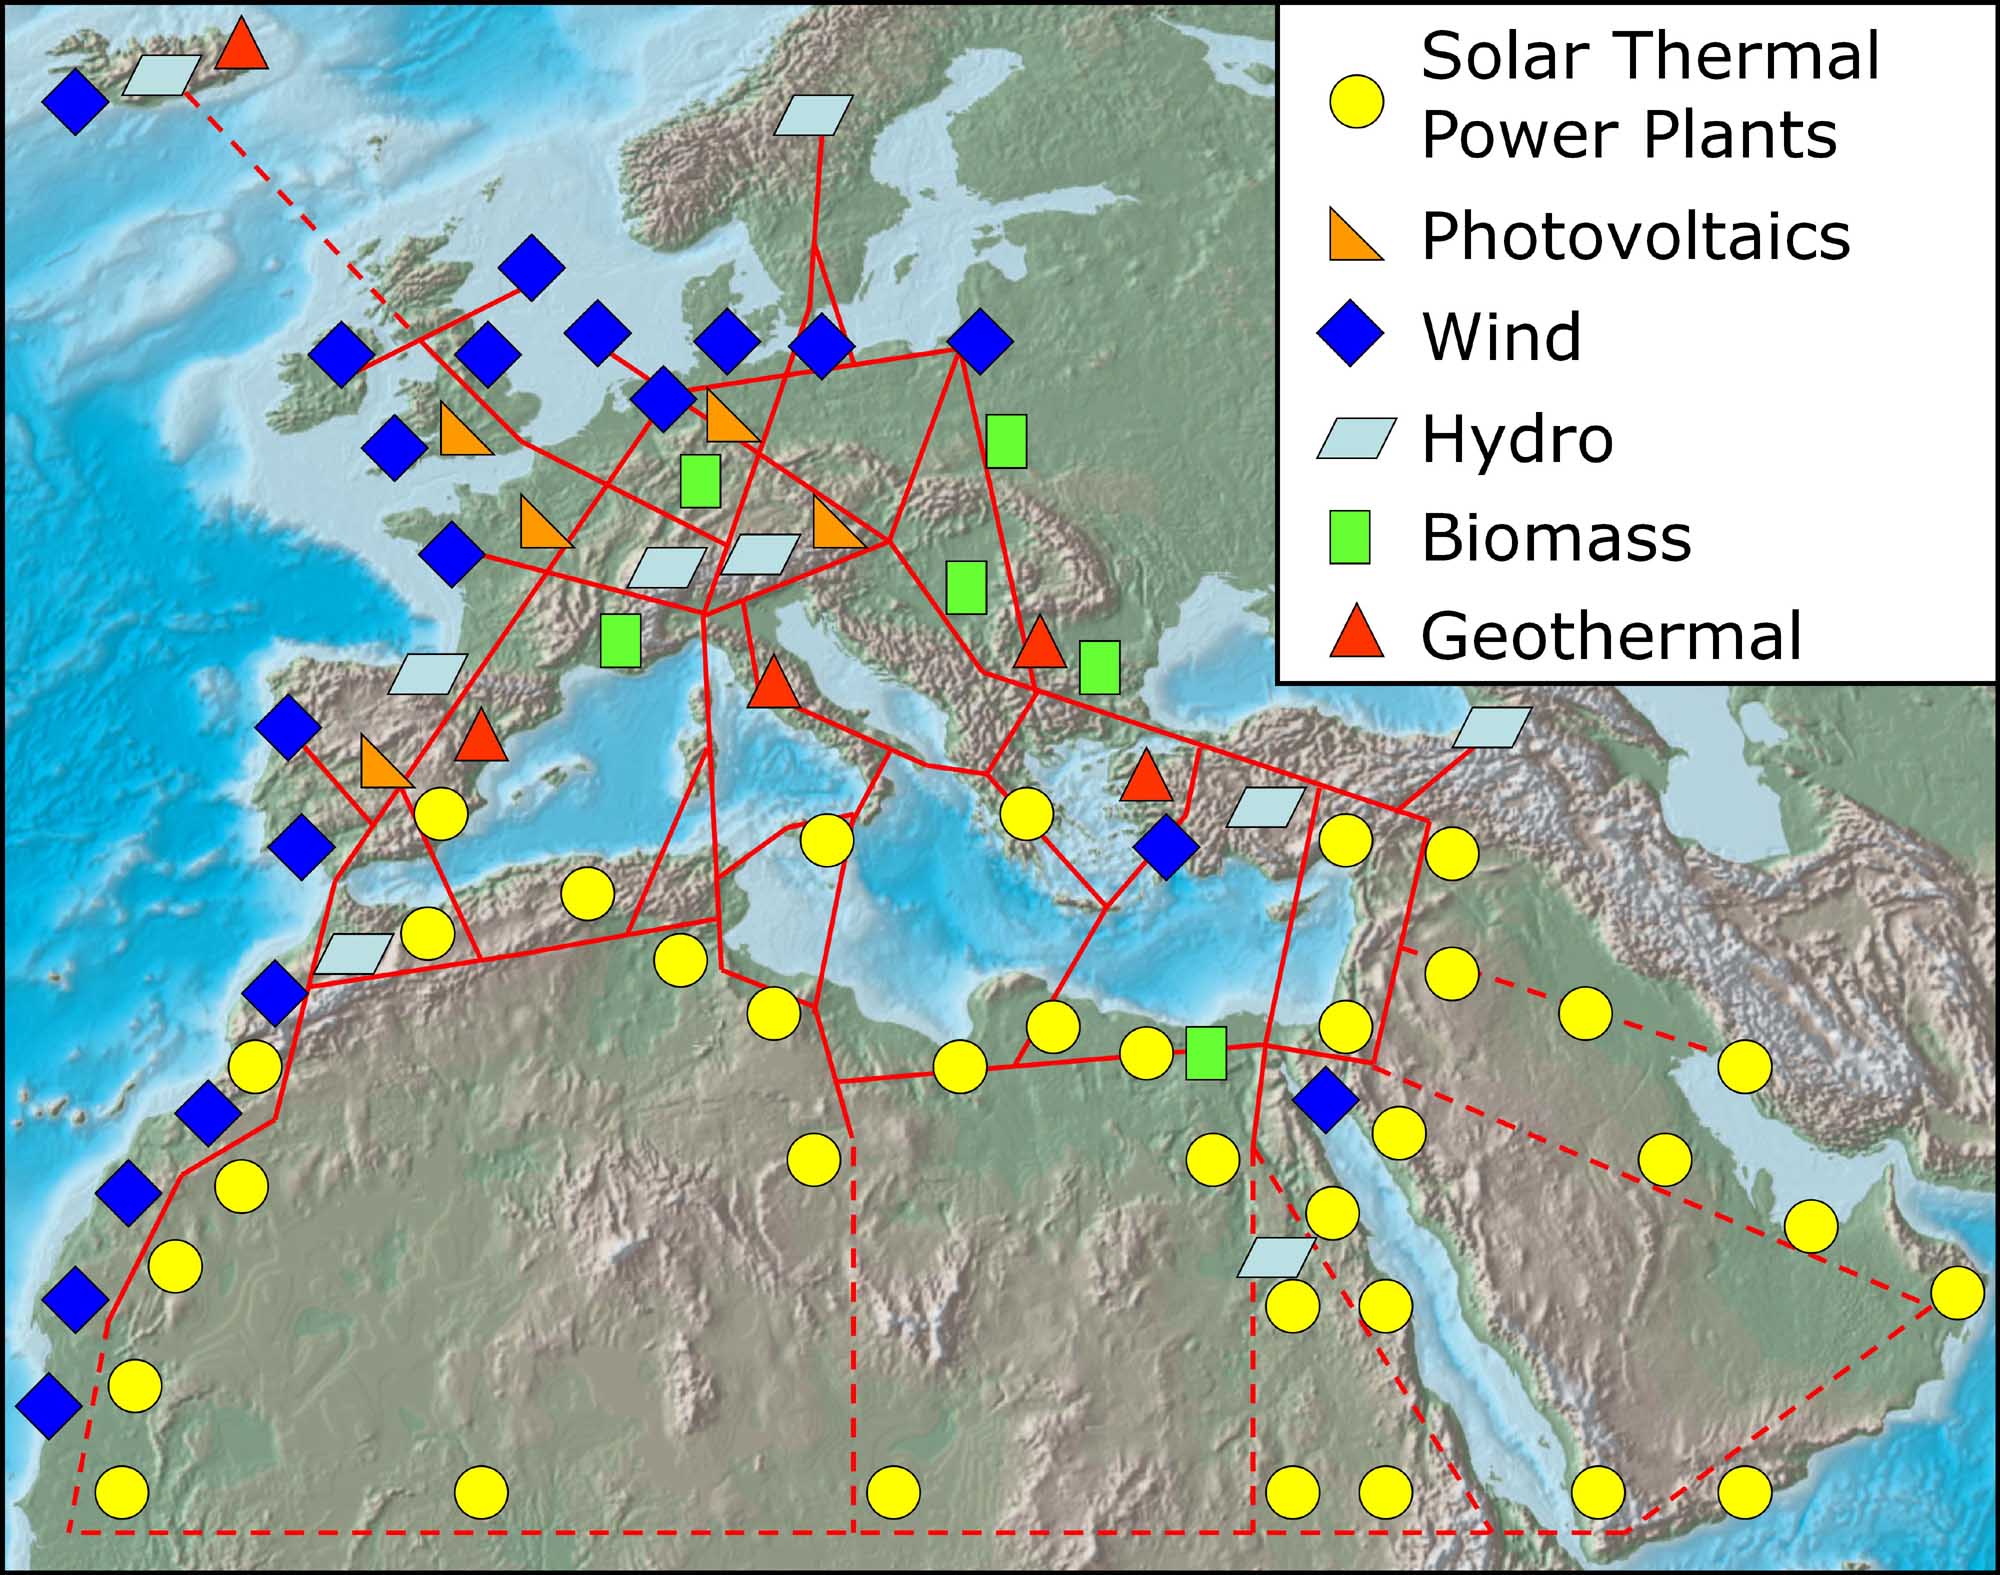
Multiple organisations and experts have championed the creation of a European supergrid. A supergrid is a grid which interconnects a range of countries and regions. Creating the European supergrid would first of all entail developing the renewable energies of the wind-rich regions of northern Europe and sun-rich regions of southern Europe while creating high capacity energy infrastructure tightly connecting the two regions. As there is more sun in summer and more wind in winter connecting these two regions would mean that the fluctuation in renewable energy supply would be lessened, producing a steady stream of renewable energy for Europe.
Securing stable access to energy is very important, but alone it does not represent all the change needed. Achieving constant access to renewable energy would make it feasible for most people to use energy without thinking about where it comes from. However, does this change really solve the energy question? Arguably not.
One of the factors contributing to current predicaments is the cultural stance which posits that it is fine to expen resources without having a sense of where they come from, the sustainability of the production process, or impact it has on environments along the way. Having an experience of access to infinite energy is not the key to triggering sustainable transitions.
It is worth trying to picture what an energy system could look like if designed to enable all stakeholders, not just expert groups, to understanding it. Nurturing a system which empowers users to build different habits by makes origin and process more visible is arguably an as important, though in some ways more difficult, part of our energy transition.
¶Looking back, looking ahead
Last edited: 2021-12-08
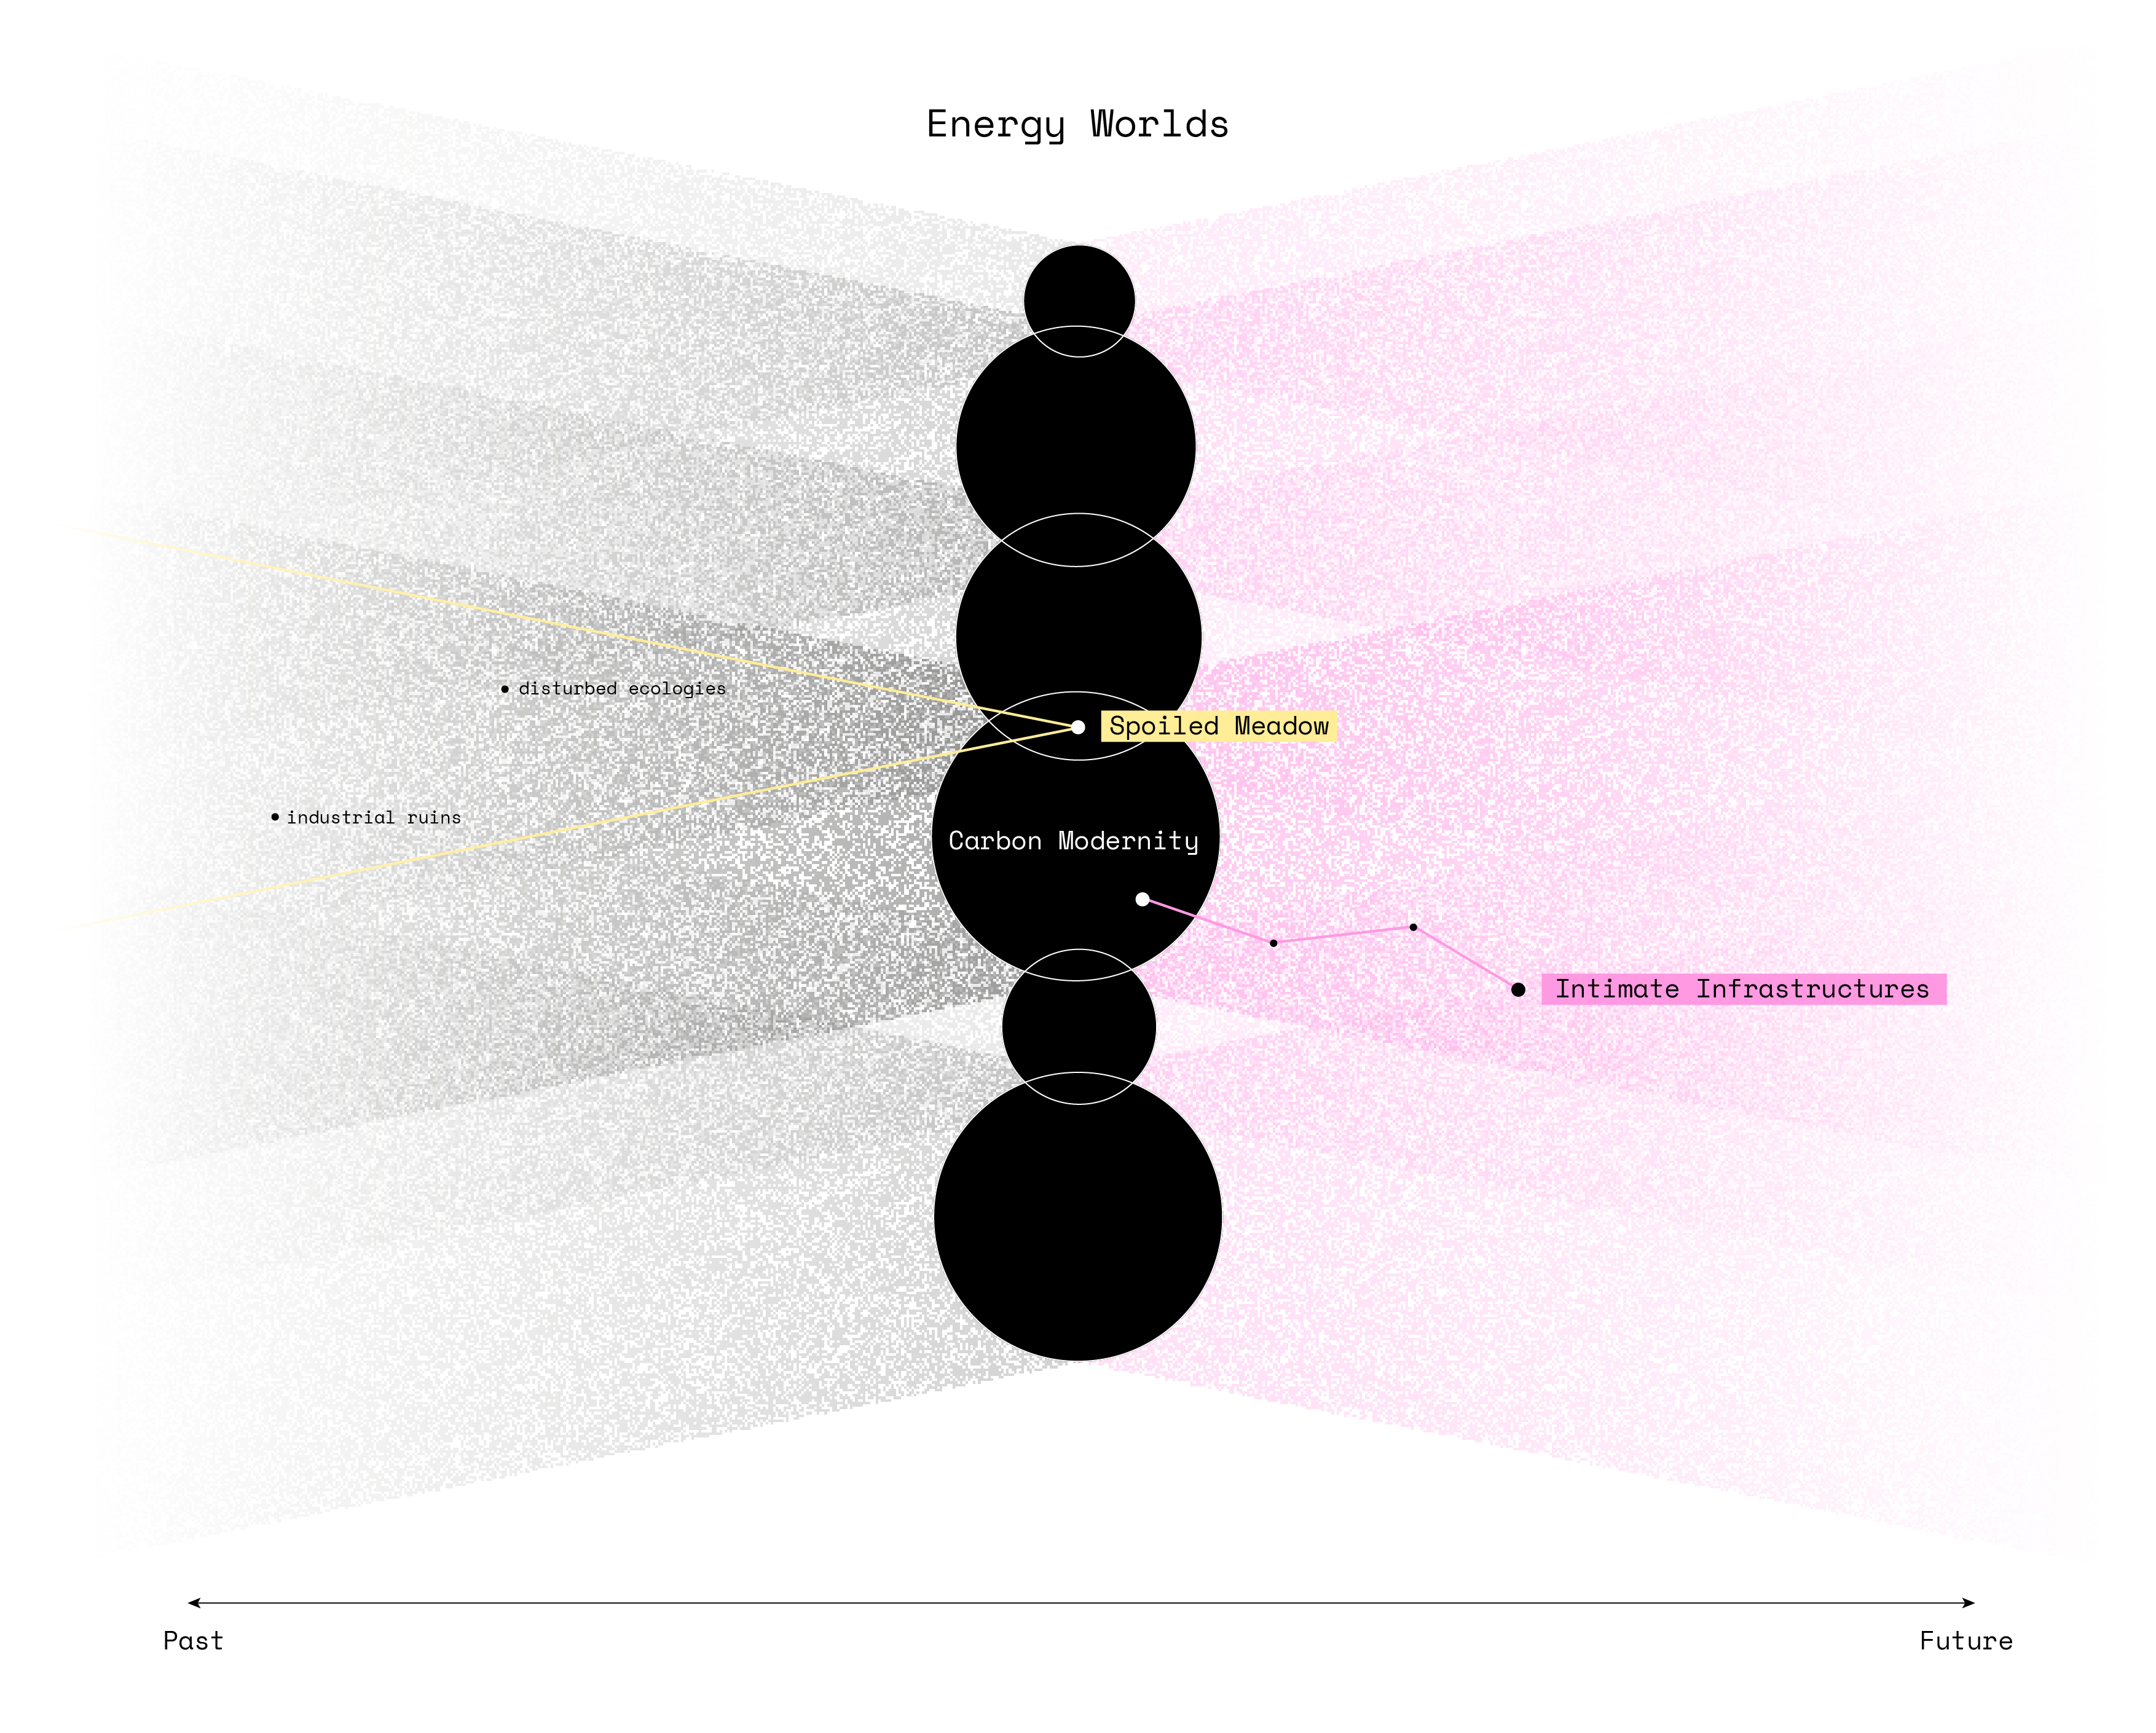
This project is about understanding possible pasts as well as possible futures of energy.
¶About the project
Last edited: 2021-12-08
Close to Home is a project by Takram London
Project Team: Yosuke Ushigome (Takram), Jonathan Skjøtt (Takram), Michael Pecirno (Takram)
Data Sources:
Elexon, World Resources Institute, GPT-J , Weather Lore , Met Office, Carbon Intensity API
manifesto
1
The Past is a Foreign Climate
We live in times of accelerating climate change which in turn produces changes in weather, which in turn causes major problems across the world.
We must acknowledge that the droughts, the flash floods, and other extreme events are not singular events, but part of a new normal.
As a result of our actions, we must change how we operate, to find ways of prospering while itigating and preventing the worst scenarios from occurring.
2
No Energy is Anonymous
Part of the problem is that energy is anonymous – we choose to deliberately hide our energy infrastructure
Many of the infrastructures most intimately linked to our current predicament are all around us and yet hidden from sight. Like pipes and power-cords hidden away from sight in a modern housing development, most people never get to set sight on and understand the ways in which energy moves throughout society.
This practice erroneously makes energy feel anonymous and of infinite supply.
3
Provenance New Vibrance
The energy used in our homes comes from real places, even if it does not come with provenance labels documenting its origin. In these places the wind blows, the sun shines, or perhaps some gas plant fires its turbines. There are people and communities who call these places home.
In a world powered by renewables, energy becomes local and variable based on weather patterns. The weather is not just outside, but by lending power to the renewables running your devices and infrastructure it is inside as well.
This should change the shape of not just our built environment, but also how we relate to energy culturally.